Elastic’s September 2026 Developer Update: OCR, Agent Controls and Faster RAG
- Gate
- AI & ML
- Departs
- Crew
- Elastic DevRel team
- Passengers
- 813
Elastic’s September update covers layout-aware OCR, a policy-scoped CLI for agents, lower-cost retrieval and new LLM tracing in APM.

Elastic’s September developer update centers on a practical shift: making document processing, AI agent access and LLM observability easier to manage with Elasticsearch and Kibana. The announcements range from a new OCR model to a command line interface in technical preview, alongside examples of retrieval and agent monitoring. Their value depends on the workload: teams should weigh benchmark claims against their own documents and treat preview features as early releases.

The most concrete operational change is the Elastic CLI, which gives scripts and AI agents a consistent way to call Elasticsearch, Kibana and Elastic Cloud APIs. Other updates target specific bottlenecks: jina-ocr-v1 reads complex page layouts; precomputed Knowledge Indicators reduce repeated retrieval of full documents; and Elastic APM now exposes LLM inputs, outputs and token counts in traces.
Document parsing that retains page structure
jina-ocr-v1 is available through the Elastic Inference Service and through several Jina access options. It takes scanned pages, document photos, slides and handwritten notes, then returns structured Markdown in one pass. Tables are represented as HTML and mathematical formulas as LaTeX. The model recognizes text inside embedded images but excludes that incidental text from its output.

That approach addresses a familiar OCR weakness: extracting characters without preserving the relationships between columns, sidebars and other page elements. jina-ocr-v1 analyzes layout before reading, aiming to produce an order closer to how a person would follow the page. For teams processing mixed document types, a single model could simplify a pipeline that otherwise combines specialized components. The source doesn’t quantify that potential reduction in maintenance or cost, so it remains something to assess against a team’s existing workflow.
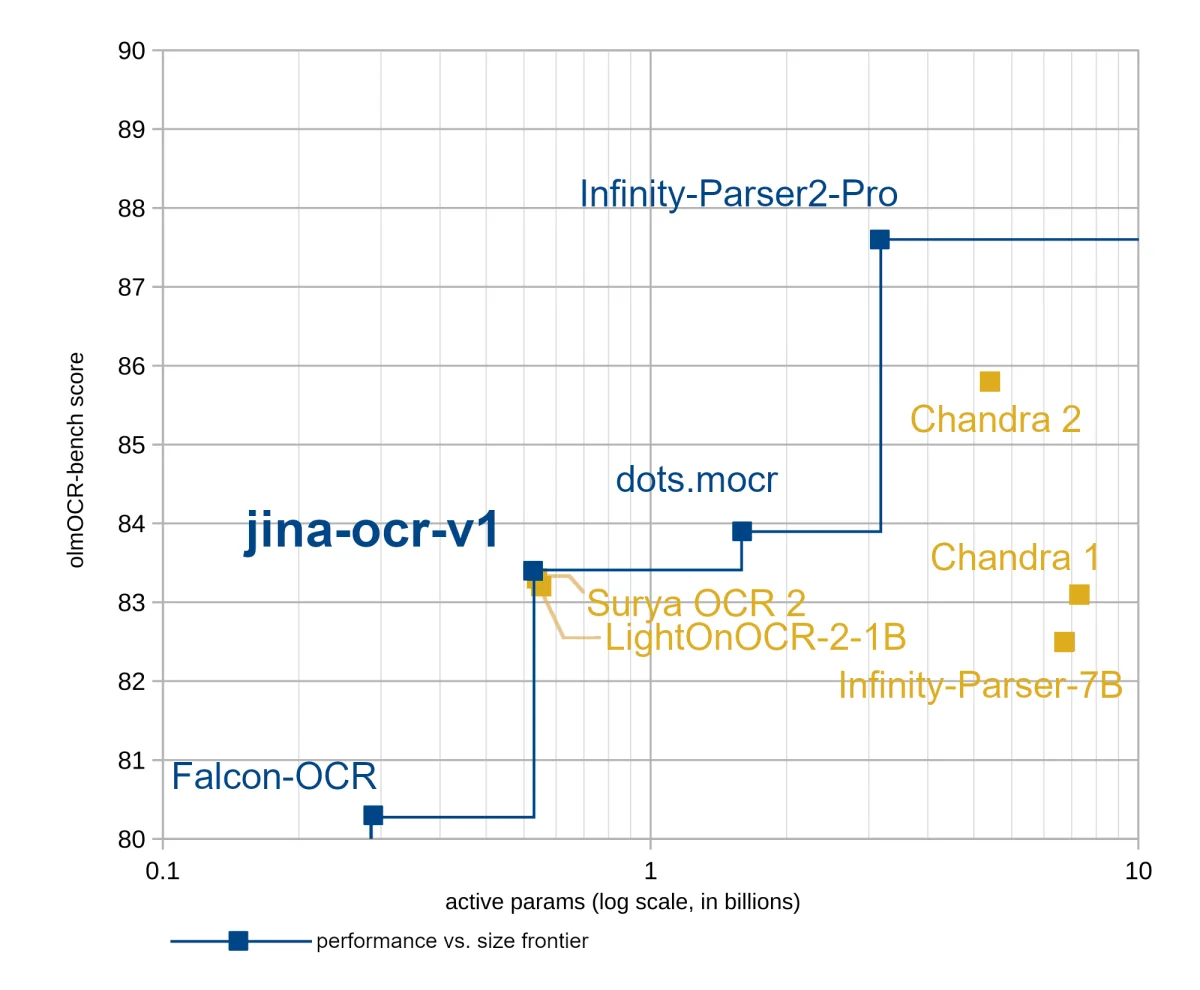
The model has 3.4 billion parameters in total and uses a mixture-of-experts design, with 570 million active during inference. Elastic describes its runtime cost and speed as comparable to a 570 million parameter model, while drawing on the larger model’s training breadth. On olmOCR-bench it scores 83.4, which the company says is the highest score among models with fewer than 600 million active parameters. It scores 91.14 on OmniDocBench, compared with 86.59 for GPT-5.2. The source says models ahead on both benchmarks use substantially more active parameters.

Language coverage exceeds 100 languages, including Arabic, Chinese, Japanese, Korean, Thai, Hindi, Greek, Cyrillic, Turkish and Czech. Mixed-language pages can be processed without extra configuration. Users can access the model through Elastic Inference Service’s chat_completions endpoint, the Jina API, a local or on-premises deployment, or the Jina AI Reader API. Native PDF support in Elastic Inference Service is still coming; the Reader API can convert PDFs and HTML pages to images automatically. The Hugging Face download is offered under CC BY-NC 4.0, while Jina On-Prem is listed for commercial deployments.
Architecture details, benchmark tables and example code are in the release post.

A consistent API surface for scripts and agents
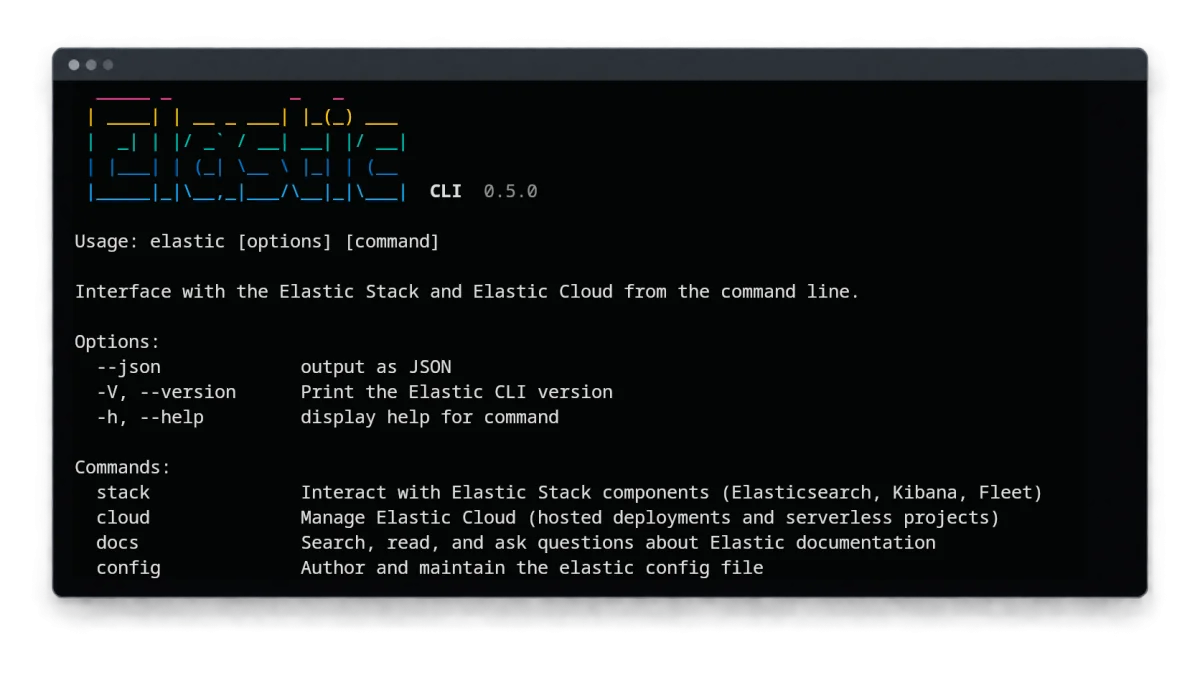
Elastic CLI is in technical preview and provides one command line entry point for public Elasticsearch, Kibana and Elastic Cloud APIs. Install it with npm install -g @elastic/cli. Its command pattern is designed to remain consistent: supply JSON through standard input or --input-file, request JSON output with --json, and receive schema validation before a request is sent. Failed commands return a non-zero exit code.
That consistency matters when a workflow crosses products. The source gives elastic es search, elastic kb data-views list and elastic cloud serverless projects create as examples that follow the same conventions. The CLI also includes helpers for common Elasticsearch tasks: bulk ingest from files, directories or standard input; streaming large search results as NDJSON; and watching for new documents as they arrive.

Credentials are stored in the operating system’s keychain: macOS Keychain, Linux Secret Service or Windows Credential Manager. The config file contains a keychain reference rather than the API key itself, keeping credentials out of shell history and agent transcripts. Teams can set allowed or blocked command lists globally or per context. This supports narrower access, such as letting an agent read data while preventing deletion commands.
Every command validates inputs against a JSON Schema before network access, and --dry-run performs validation without sending a request. Destructive commands ask for approval in an interactive terminal. In non-interactive sessions, they require an explicit --yes flag. For agent workflows that return more data than needed, --output-fields and --output-template can reduce the response to selected fields or a Mustache-style template.

Agent Skills now delegate API calls to the CLI
Elastic Agent Skills give coding agents such as Claude Code, Cursor, Copilot and Gemini CLI guidance on tasks involving Elasticsearch and Kibana. The skills cover matters like choosing fields, staging a reindex and checking cluster health. Previously, API access could rely on hardcoded curl commands containing endpoints and credentials, which can become stale when keys rotate or hosts change.
The skills now express operations as HTTP shorthand and map them to CLI commands. For example, a mapping request becomes elastic es indices get-mapping --index '<index>', while an ES|QL request maps to elastic es esql query. The skill supplies task knowledge; the CLI handles validation, credentials and command policy. Install the CLI and skills with npm install -g @elastic/cli and npx skills add elastic/agent-skills.

Skills for Elastic Cloud onboarding, Elastic Workflows and Kubernetes investigation are available. Skills for ES|QL, ingest, reindexing, index design, Kibana dashboards and alerting are in progress. The CLI and agent skills post describes the safety controls and serverless command profile.
Knowledge Indicators cut repeat document retrieval
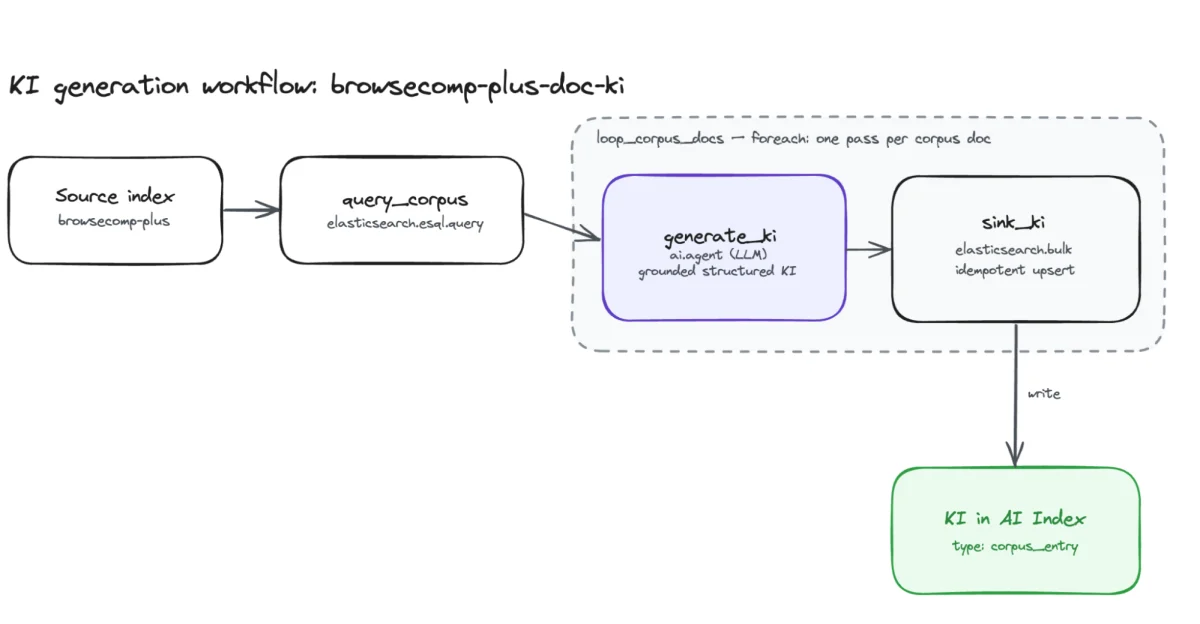
Conventional retrieval augmented generation often brings full documents into an agent’s context for each question. Elastic’s Knowledge Indicator approach instead uses a one-time batch workflow to extract a compact record for each document and store those records in an Elasticsearch AI Index. An LLM creates each indicator with a title, plain-language summary, entities, answerable questions and a tagline.

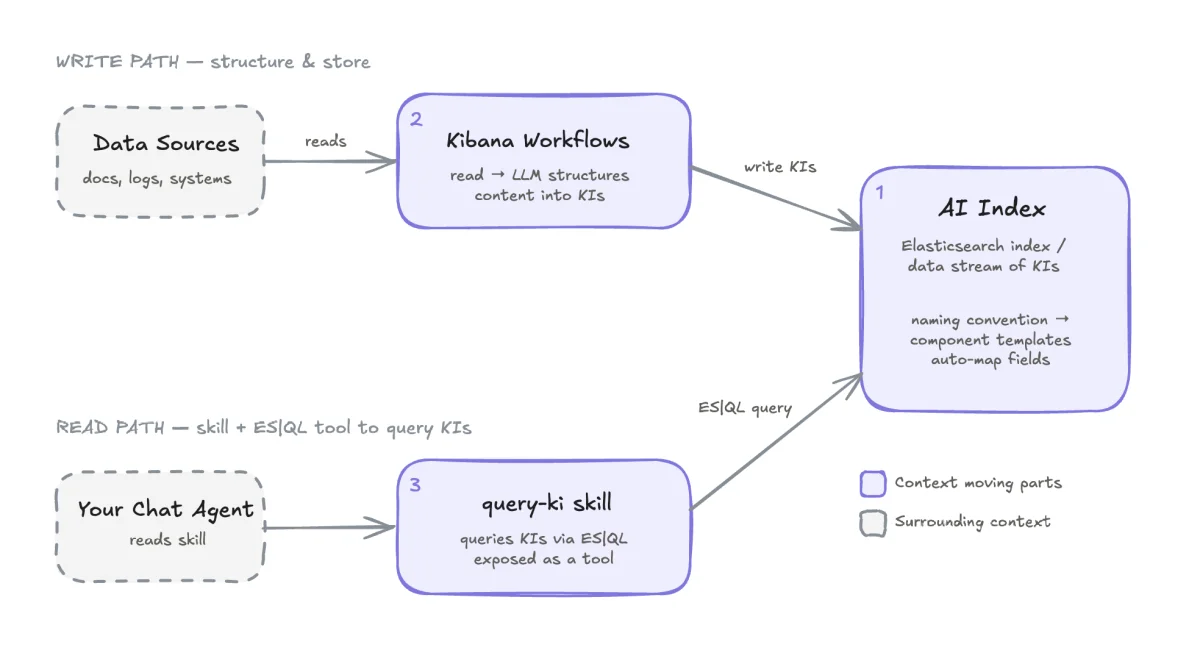
At query time, the agent searches the indicator index using hybrid BM25 and semantic retrieval with ES|QL, then grounds its answer in the retrieved indicators rather than loading full documents. Elastic reports one test using the question, “What was the actress who played Torvi from Vikings also known for?” Standard RAG used eight tool calls, 386,187 tokens and 44.86 seconds. The Knowledge Indicator approach used two tool calls, 27,625 tokens and 15.22 seconds. The source says the answers were equivalent and grounded in the same material.
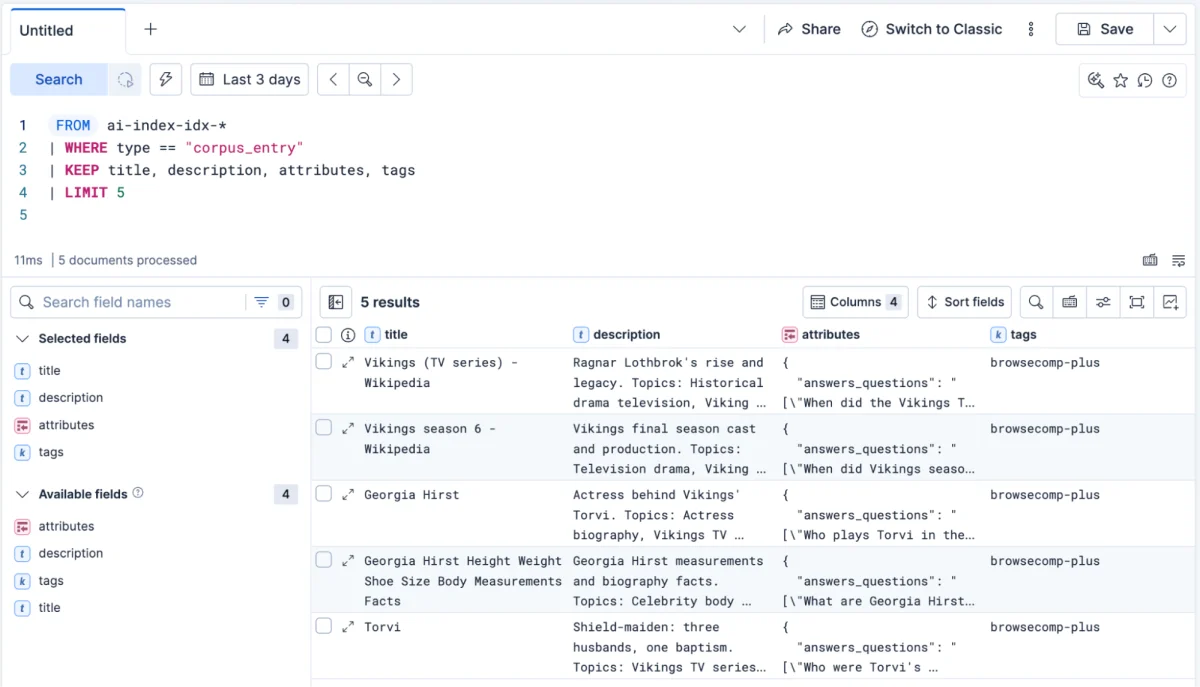
Those figures come from one query, so they don’t establish the same savings across different corpora or question types. The tradeoff is also clear: teams need an indexing workflow to generate and maintain indicators as source content changes. The post says the approach works with LangChain, Elastic Agent Builder and Claude Code without changing the agent harness. Its technical walkthrough includes Workflow YAML, the indicator structure and the ES|QL query.

LLM calls become visible in APM traces
Elastic APM can now show LLM calls from OpenTelemetry-instrumented applications as spans in the trace waterfall. A new GenAI tab in the span flyout displays the system prompt, input messages and model response, with copy controls for each field. Token counts appear on each GenAI span row, helping engineers spot which call accounts for usage in a trace with multiple model requests.
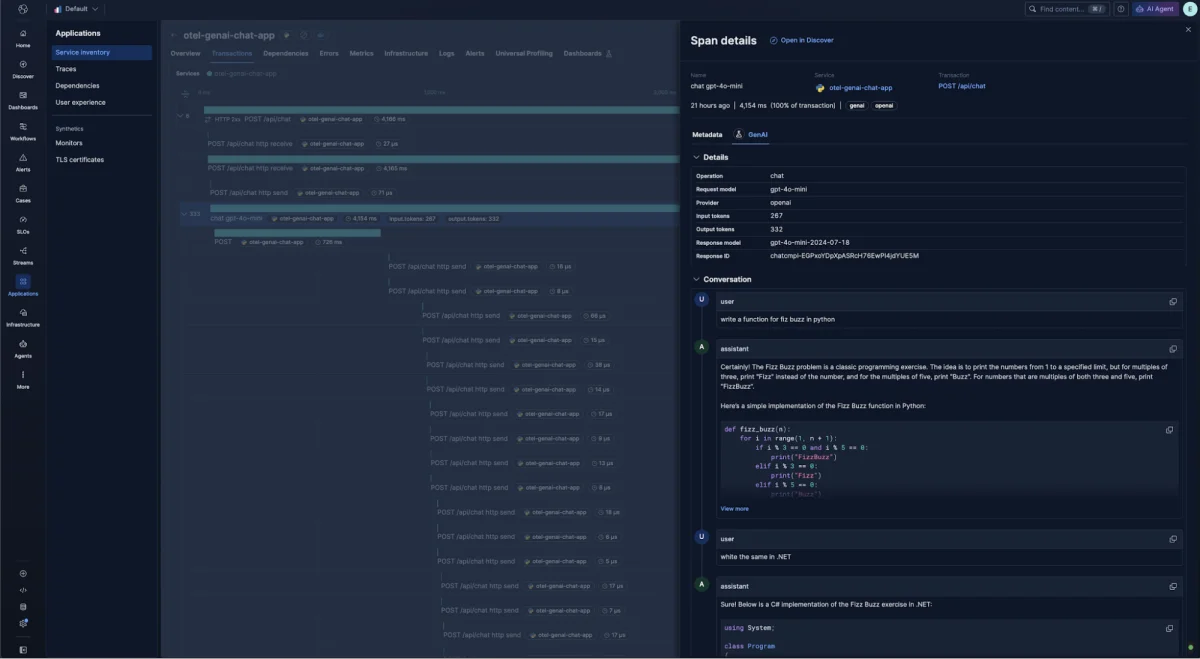
The feature follows OpenTelemetry GenAI semantic conventions version 1.37.0 and works with instrumented providers including OpenAI, Anthropic and AWS Bedrock. No Kibana configuration is needed when the instrumentation already emits the required GenAI attributes. It is in technical preview on Serverless, with Stack 9.6 support planned next. Setup guidance and the relevant OTel attributes are in the APM walkthrough.

Auditing AI coding agent activity
Elastic Security Labs describes a way to distinguish coding agent actions from a developer’s activity in endpoint logs. Cursor hooks fire at lifecycle points such as shell execution, MCP tool calls, file reads and edits, and session start or end. A 280-line Bash script captures the events as structured JSON, then Elastic Agent sends them to Elasticsearch through a custom logs integration.

Across more than 1,100 developer machines, the team collected 13 million events. File reads outnumbered shell commands by roughly four to one, suggesting agents spend much of their activity inspecting a codebase. The logs also showed more than 300 distinct MCP servers; 86% connected to only one or two people. That inventory can help teams understand which tools are in use and where to examine activity more closely.

ES|QL queries can search for patterns such as reads of credential files, download-and-execute sequences, or MCP server usage across a fleet. The setup observes activity by default rather than blocking it. Cursor hooks can also block actions when teams want approval gates for sensitive operations, and the same general approach applies to Claude Code and other agents with similar hooks. The implementation post links the collector, configuration, integration setup, queries and notes on privacy and transparency.
More technical reading and upcoming events
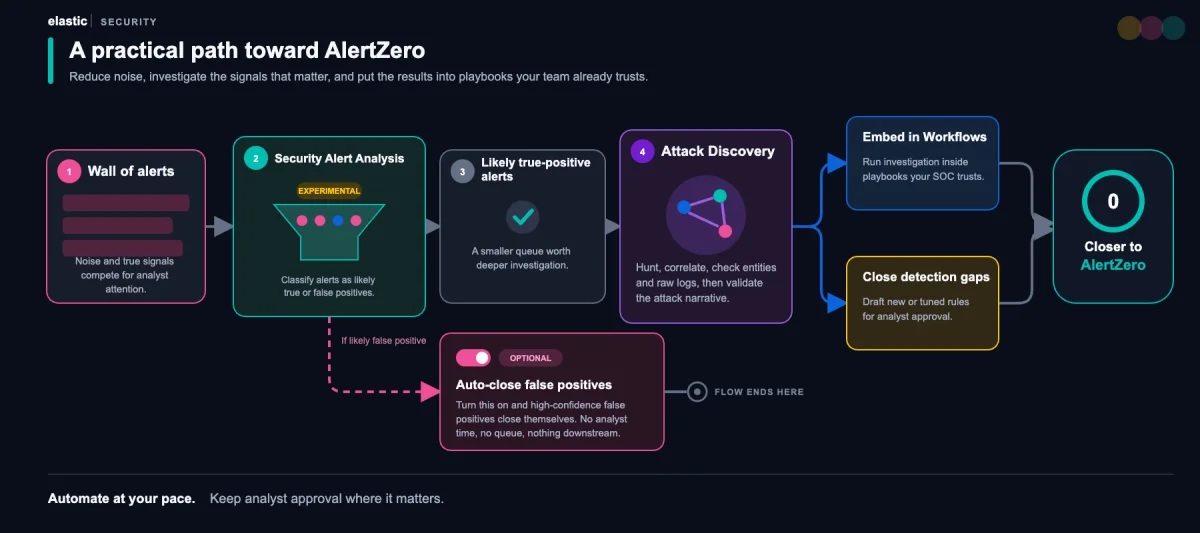
Other featured posts cover Elasticsearch Vector Database, a serverless option for vector applications; an agentic alert triage workflow that reportedly raised accuracy from 60% to 92%; and Lucene query rewrite rules that made two string scans in columnar mode 2.3x and 1.6x faster. The roundup also includes a look at verifiable AI root cause analysis with Agent Builder, tracking Kibana dashboard use, and writing documents with past timestamps into Elasticsearch time series data streams.
Video selections include a technical tour of Elasticsearch’s metrics engine, case management in Elastic Security 9.5, and Kubernetes incident investigation. Community links cover Notion’s lexical search reindexer, processing varied IoT logs with Fluent Bit and Elasticsearch, and restricting an AI agent’s Elasticsearch access.
Elastic{ON} Tour dates listed in the update are Mumbai on September 30, New York on October 8, Amsterdam on October 20, San Francisco on November 4, London on February 25 and Singapore on March 23. The New York event is described as a day of technical sessions and practitioner discussions. Talk proposals are open for select events, with 30-minute talks sought on Elasticsearch, Kibana, search, observability, security and real-world use cases. Local user groups and Meetup listings are also available for community events.
The through line is control over the work around AI: better structured inputs, fewer repeated tokens, observable model calls and clearer records of agent actions. The next useful signal will be how these tools behave beyond demos and technical previews, especially as teams connect them to their own documents, permissions and production workloads.